Exercise 1A :)
Purpose
The movement of a solute through a selectively permeable membrane is called dialysis. The dialysis tubing used in this experiment has microscopic holes that allow small particles or molecules to move freely through the membrane while larger compounds will take longer to diffuse through, or may not move at all. In this first activity, we will allow a single piece of dialysis tubing filled with glucose to sit in a solution of distilled water. We will know if the tubing is permeable to glucose if upon testing for said sugar, we find traces of it in the solution surrounding the dialysis bag.
Introduction
The development of dialysis tubing and dialysis machines during the mid 20th century changed the way biologists and other scientists looked at the semi-permeable cell membrane. Once blind hypothesizes and speculation, the experiments conducted with dialysis tubing allowed scientists to see before their very eyes the nature of selective permeability, which means to allowing some substances through while blocking others. And thus, in this experiment, we follow in the footsteps of the early scientists as we truly see selective permeability in action. By seeing it in large scale, it is easier for us to imagine the microscopic environment of a cell membrane in a living cell. While the membrane is selectively permeable, the force that drives the movement of particles across is diffusion. Diffusion is the spreading of particles from a high concentration to low concentration. For example, say one lights some sulfur on fire in a classroom and then quickly extinguishes the flame. At first, the air near the burned sulfur would smell strongly of rotten eggs. Wait a few minutes though, and the whole room would end up smelling like rotten eggs, although less strongly than in the first instance. This is because the smell spreads out from an area of high concentration to an area of low concentration. The end result is dynamic equilibrium: The particles of sulfur are moving around in the air, but there is no net movement of particles. This process is similar with a selectively permeable membrane.
Methods

Data
Change Tubing Color Over Time

Chart
This table shows what the solution color appeared as in both
the dialysis bag and the beaker at the beginning of the experiment and again
towards the end. The change in color indicates the presence of glucose and
whether it all stayed inside the dialysis bag/beaker or if it diffused out.
Discussion
When the bag started out opaque, it was a solution of 15% glucose and 1% starch. Once we let the dialysis bag sit in the solution of iodine, it was able to diffuse out and thus change the color of the bag. Through the changes in color of the solution in the dialysis bag from opaque to black, we are able to conclude that when the glucose inside the dialysis bag diffused into the beaker full of the iodine water and the iodine water went into the bag which changed the color of the solution inside the bag to black. While the iodine solution was orange at the beginning, it remained the same color throughout the experiment. Initially we thought the glucose would diffuse out of the dialysis bag into the iodine water, and our hypothesis was correct. Water molecules are the smallest, then IKI molecules, glucose, and starch. Glucose, water, and iodine (IKI molecules) were small enough to pass through the dialysis bag which was used as a selectively permeable membrane. If the experiment were to be modified so that the water diffused into the dialysis bag, the water and starch would have to start off in the beaker while the glucose and IKI molecules would start inside the dialysis bag.
|
Conclusion
As the results of the lab showed, smaller molecules such as water, glucose, and iodine are able to pass through a selectively permeable membrane. This was shown through the changes in color of the solutions which proved that when certain molecules diffused in and out of the dialysis bag, the colors changed.
References
https://www.boundless.com/physiology/textbooks/boundless-anatomy-and-physiology-textbook/cellular-structure-and-function-3/transport-across-membranes-42/osmosis-331-11470/
http://www.davita.com/kidney-disease/dialysis/the-basics/the-history-of-dialysis/e/10431
Exercise 1B
Purpose
Osmosis is the movement of water from a high concentration to a low concentration within a solution. In this second part of the experiment, we have several dialysis bags filled with different molarities of sucrose. We will place these bags in separate tanks of distilled water, and see after 30 minutes where the water moved. If our bags increase in mass, we know the bag was in a hypotonic solution, which allows water to rush inside our mock cell. Other wise, should the bag lose mass, then the solution was hypertonic, and water diffused out of the cell where a majority of the sucrose could be found.
Introduction
Now that we have established what selective permeability and diffusion are like on a large scale, the next exercise is all about how solute concentration can affect diffusion across a selectively permeable membrane. Again, I would like stress that diffusion is the spread of particles from a high concentration to low concentration. When a solute is present that cannot cross the membrane, the permeable solvent (usually water) will still achieve equilibrium with the solute, even if it means that there are different amounts of water on each side of the membrane. Thus we get three states, called hypertonic, isotonic, and hypotonic. A membrane placed in a hypertonic solution will loose water because there is a higher concentration of solute outside the membrane. In an isotonic solution, the concentrations inside and outside of the membrane are the same, so there is no net water movement. Finally, a membrane placed in a hypotonic solution will gain water because there is a higher concentration of solute inside the membrane.
Methods

Each dialysis bag was assigned a different molarity of sucrose to determine how the tonicity of the solution affects increase or decrease of the dialysis bag's mass.

The solutions were ordered by increasing molarity, as shown in the picture above. Each dialysis bag was carefully blotted and massed before and after being submerged in its assigned solution. From this information, we were able to determine a percent change in mass for each dialysis bag.
Data
Mass of Dialysis Bags after Being Submerged in Sucrose

Graphs

As the molarity of the solutions in the beaker increases, the mass of the bag also increases.
Discussion
This lab demonstrates the process of osmosis through the movement of water from the beaker into the bags containing the sucrose. As the amount of sucrose of each bag (independent variable) increased, the weight of the bag (dependent variable) itself also increased. When we placed the different sucrose bags within the beaker filled with distilled water, the water began moving from the beaker, through the permeable membrane, and into the bag. This movement of water from an area of high concentration to lower concentration is called osmosis.This is evident though the increase of weight within each of the bags. Also, because each of the bags contained a different amount of sucrose concentration the amount of water that moved within each bag also differed. As a result, the graph displaying the weights of the bag increased as the amount of sucrose concentration was increased. The only concern for this lab is that the bag of distilled water within the distilled water beaker also increased in weight which should not have because it should already be an isotonic solution. This increase in mass might have been due to the excess water on the bag after we pulled it out the beaker and weighed it again. Otherwise our predictions about the bags all increasing in weight were correct.
Conclusion
In this lab, we were testing the relationship between a solute's concentration and the movement of water molecules through a selectively permeable membrane. Water moves quickly through the dialysis bag, our selectively permeable membrane, in order to reach equilibrium between the two solutions.
References
http://teachers.henrico.k12.va.us/godwin/strauss_s/sscwebpage/tutorials/cell_transport_tutorial.pdf
Exercise 1C
Purpose
This activity involves the use of potato cores, which function as non-living plant cells but will still abide by the rules of water potential and solution tonicity. In a similar manner to the dialysis bags, we can determine a solution's water potential by finding the masses of each potato core before and after being submerged in the given solution. Water will always move from a higher to lower potential, so in the case where more of the solute is outside the cell, there is more water within the potato core and therefore more potential. So water therefore leaves the cell and the mass steadily decreases until the solution is isotonic and secured at equilibrium.
Introduction
When we combine all of the concepts we have learned above and combine them, we get water potential. Water potential is not a process, it is merely an explanation to better define how water diffuses. Water diffuses from an area of high water potential to area of low water potential. Water potential is dependent on two thing, solute concentration and pressure. Below is the full equation:

The potential of pure water is zero, thus water potential cannot be positive. Its highest value is zero. Although this sound mightily similar to hypertonic, isotonic, and hypotonic solutions, this of it like this: water potential is partially based on solute potential. The solute potential of solutions on either side of a selectively permeable membrane is dependent on the solution the membrane is in is hypertonic, isotonic, or hypotonic.
Methods

Tom Judd uses a metal rod and hollow tube to harvest the potato cores


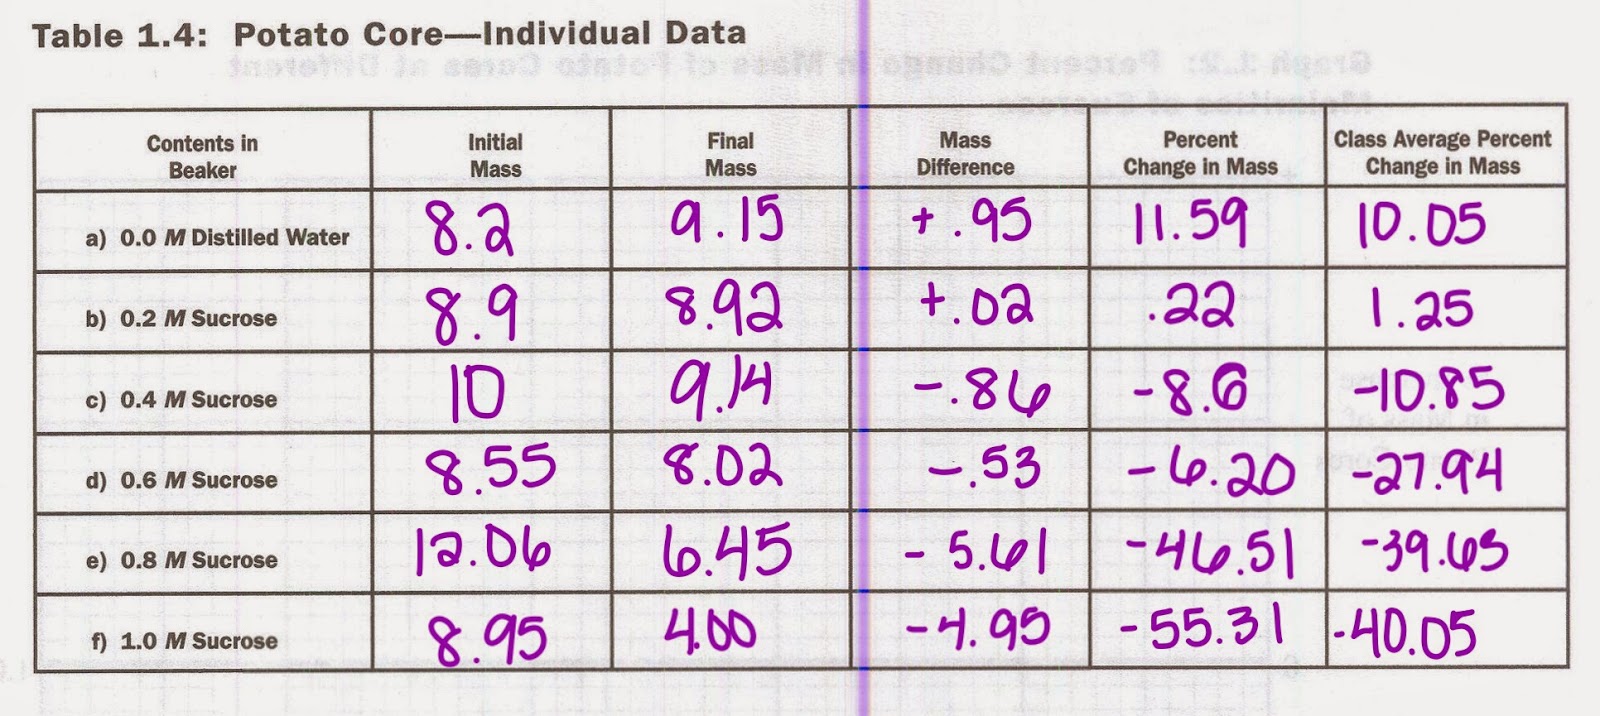
Data
Mass of Potato Cores and Percent Change
Graphs and Charts

In this graph, the change in mass of potato cores decrease as the sucrose molarity increases except for one outlier within the .6M beaker.
Discussion
Through the results of this lab, we have discovered that the potato increased in weight when it was placed in the solution of distilled water, but then decreased in weight as the sucrose molarity increased. This increase of weight of the potato molecule is due to the fact that the potato itself contained amounts of sucrose. This means that the concentration was higher inside the potato, and that water will rush into the potato to make it swell and gain mass. Then, as the concentration of sucrose in the beaker increased, less water moved into the potato until it reached a point where the concentration of sucrose outside the cell also equaled the concentration inside the potato. This equilibrium point is marked on the graph as the point where the line hits the 0 on the x-axis. Once the concentration of sucrose within the beaker became greater than the potato, the potato lost water/ weight due to the osmosis of water from low to high concentration. This caused the potatoes to shrink and shrivel because of this water loss. A problem that we had with this lab is that we had an outlier within our results. For the .6 M sucrose concentration, instead of steadily decreasing like the rest of the results we had, the .6 M had a lower change in mass than the .4 M sucrose beaker. This outlier might have been due to not weighing the potatoes correctly or the slight confusion we had we took out the potatoes and lost track of two of the lab results. So, for next time, we now know to be extra careful when handling multiple tests and to keep track of everything. Especially when we have 24 slices of potatoes on the table!
Conclusion
http://www.phschool.com/science/biology_place/labbench/lab1/watpot.html
Conclusion
Through this lab we discovered that potatoes contain sucrose molecules which makes them want to take in water in order to become a hypotonic solution which makes the plant turgid. This shows that potatoes have a lower water potential and a higher solute potential than the distilled water solution because they wanted to take in water.
Referenceshttp://www.phschool.com/science/biology_place/labbench/lab1/watpot.html
Exercise 1D

By using this equation for solute potential and the molecular concentration of .3 M from the previous lab, we are are able to find the water potential. Water potential of the potato cells is -7.35435 bars. So, if the water potential of the solution is lower than this, water would diffuse out. And if the water potentiometer of the solution is higher than -7.35435, water would diffuse in.
Exercise 1E
Plasmolysis is the shrinking of the cytoplasm within plant cells. The cell wall is moved further from the cytoplasm and cellular membrane. Plasmolysis happens when plant cells are placed into a hypertonic solution and water diffuses out of the plant cells.

This picture is an example of what happens within a cell during plasmolysis
A common accurance of plasmolysis happens here every winter when is snows. As the snow plows are hard at work to move and salt the snow, some of the salt reaches the grass. This then causes the grass to die. This happens because the concentration of he salt outside the plants are higher which causes the water to diffuse out. This loss of water is bad for the plants because in order for plants to be healthy, they must be placed in a hypotonic situation.
References:
http://www.tutorsglobe.com/homework-help/botany/plasmolysis-73486.aspx --- plasmolysis picture
https://www.shodor.org/master/biomed/physio/dialysis/hemodialysis/fivea.htm --- history of dialysis tubing