Friday, December 19, 2014

Cell Communication Lab

Purpose
In this experiment, we were trying to find out how yeast cells manage to communicate and thus mate asexually in order to produce offspring. In order for a message to be communicated, a signal must be sent and then received by another being; this lab will prove how yeast cells go through this communication process in order to produce a required response for the production of yeast.

Intro
Both unicellular and multicellular organisms use cell communication in order to elicit a response which helps an organism  coordinate and respond to their environment. Cellular communication can occur through direct contact, local signaling, or long-distance signaling. For a response to occur, a message much reach a receptor that is able to receive that type of message which then turns on the ability for many other reactions, or a cascade. Pheromones are a type of signaling molecule that is secreted from one organism  and detected from another organism thus providing various messages through this cellular communication and eliciting a change. 
 

As you can see above, the budding and single cells are both present on this slide. Budding cells are cells clumped together, while single cells are the ones all by themselves. Budding cells contain both a and alpha DNA, while single cells contain either one or the other.
 
Methods


In our experiment, we tested yeast reproduction. We grew yeast is two different environments: broth and a sugar like gelatin. We created three copies of each environment. One with only a type, one with only alpha type, and one with both. We then took samples and placed them under a microscope.


We then counted how many yeast were present on a sample size of our tray and recorded it into our data.
 
Data

Data was gathered by the picture taken through the microscope during the lab and counting out the cells found within that field

This table shows the number of single haploid and budding haploid cells within the alpha-type and a-type slides. As time increased, the number of budding haploids increased more than the single haploid cells. 


This is a similar chart except this one contains the the number of various cells and zygotes from the mixed culture. The budding haploid, shmoos, budding zygotes, and asci all increased after 24 hours in the incubator.


Graphs and Charts


This graph reflects the first table of the a-type and alpha-type cells 


This graphs reflects the second table above of the mixed combination of a-type and alpha-type cells


Discussion
Throughout this lab, there were a few notable differences between the A-type and Alpha-type strands of yeast while they were observed in their cultures. Over the course of the first night when stored in the incubator, the Alpha-type reproduced at a more accelerated rate than its counterpart. In addition to this, the genomes differed between both strands, yet under the microscope the behavior of each was nearly identical. In the isolated cultures, neither strand seemed to move, and no schmooz were formed. However, in the mixed culture, the pheromones from each strand were received by receptors within the plasma membrane of the opposite strand, and each strand morphed its physical structures to as to move closer to its counterpart. Schmooz can be detected by identifiying unique, irregular shapes of yeast when they are normally spherical, perfect circles.

It has become evident from this lab that yeast cells cannot communicate by direct contact, but strictly via pheromones. Yeast has no flagella or cilia to move, which is why schooz must be formed to acheive gradual movement across the dish. Pheromones are used to notify far-off yeast cells that the counterpart is present, so that they can reach each other and eventually mate. There is really no other means to communicate that other cells are nearby. Pheromones will be transduced faster if the yeast cells are closer together. For this reason, it is understandable if yeast cells that are further away take more time to respond by creating schmooz.

Conclusion
We can conclude from this lab that the most favorable environment for yeast reproduction is when there is ample food and both a type and alpha type present. This makes sense, as this is a very secure environment in which yeast can thrive. Although yeast can reproduce when there is only one reproductive type present, best results are achieved when their is a mix. It is always better to recombine DNA and increase genetic variability than to have many others have the same DNA. It leads to a higher survival rate for the species, because one genetic defect cannot wipe out the entire species.
References
http://rsob.royalsocietypublishing.org/content/3/3/130008

Carolina Cell Communication for AP Biology


Cell Cycle Video

Wednesday, December 10, 2014

Plant Pigments & Photosynthesis

Exercise 4A 

Purpose
In this lab, our experiment was to use chromatography paper to separate plant pigments and to measure the rate of photosynthesis in isolated chloroplasts with the use of a dye. Capillary action helps move the solvent up the chromatography in order to show us the different rates in which chlorophyll's pigments travel and are thus separated.

Introduction
Chromatography is the separation of a mixture by passing it in a solution through a medium, such as paper, in order to reveal the different rates in which the components travel at. Pigments on a chromatography paper may travel at different rates due to their solubility in the solvent. In spinach leaves, pigments that are found inside the plant are chlorophyll, xanthophyll, and carotene. While chlorophyll is the most abundant pigment in spinach as well as all plants, all of these pigments will still show up on chromatography paper.


Methods


We first crushed up a leaf, and then smeared the green die on chromatography paper. We then placed a small amount of water in a graduated cylinder and placed the paper in it, making sure to keep it suspended.

By means of capillary action, water was absorbed through the chromatography paper, spreading out the green die.


Data

This is a picture of the chromatography paper from our lab. Although we had a gaping hole at the bottom, the results still came out fine. Using the ruler, we marked off the bottom of each color.


This table shows all the measurement of each color band in millimeters and the total distance the water moved up the chromatography paper.


This table shows the Rf of the different pigments, which is the the distance pigment migrated over distance solvent front migrated.

Discussion
In chromatography, water will be absorbed vertically by means of capillary action. As noted in the provided pictures, not all of the plant pigments were carried the same distance as the water. This phenomenon occurs because not all of the pigments are equally soluble, and will therefore stop at various points on the paper. While chlorophyll a and b are really the only pigments necessary to carry out photosynthesis, carotenoids are important to absorb various wavelengths of light that will otherwise cause damage to plant cells. To focus specifically on the distance traveled by all pigments, scientists use an Rf value, which is a ratio that compares the distance migrated by the pigment to the distance traveled by the entire solvent. The Rf value could change substantially if a solvent were used that cannot be absorbed into the paper as well as water. The pigments will not change their own properties, yet they will only travel as far as the solvent will let them. As a result, it is important to use a very polar liquid (like water) for this experiment in order to see the pigments separate as much as possible.

Conclusion
From this lab we discovered that carotenoids are the most water soluble, and chlorophyll b the least soluble in water. From this, we can learn why leaves change color in the fall. After the tree cuts off water supply to the leaves, the green chlorophyll pigments break down before the yellow pigments, leaving a yellow leaf. In time, the yellow pigments break down as well.

References 
http://www.rpi.edu/dept/chem-eng/Biotech-Environ/CHROMO/chromintro.html


Exercise 4B

Purpose
In the second part of our experiment, our purpose was to study photosynthesis by measuring the transmittance of light over a certain period of time with a spectrophotometer and a dye reduction technique. Since we know wavelengths of light power photosynthesis and cause the production of ATP, we wanted to find out the different levels of transmittance during the photosynthesis process within a chloroplast (in our case, spinach) as well as prove that in order for light reactions to occur, chloroplasts and light need to be present.

Introduction
A spectrophotometer is a device that consists of two instruments: a spectrometer which produces light of any selected color/wavelength, and a photometer which measures the intensity of light. Since light is part of a continuum of radiation or energy waves, the energy that is given off from light is used to power the process of photosynthesis in chloroplasts. Dye reduction is a technique where a dye, sometimes DPIP which is a redox dye, is used to look at the change of color of the solutions or mediums in an experiment. In plants, carbon fixation is when light is absorbed by leaf pigments atmospheric carbon dioxide is converted to carbon compounds which can provide energy to produce ATP. 


Methods


We first created different environments using various chemicals, some being favorable to chloroplasts, some not. In addition, some environments were given boiled chloroplasts, some un-boiled chloroplasts, and some no chloroplasts at all. In the photo above, Judd is creating these environments. 


We then shined an incandescent light bulb on the different test tube environments (sparing one which used to calibrate the spectrometer.) The large jug of water was used as a heat sink, as 95% of an incandescent's energy is given off as heat. After 5 minutes, we removed the test tubes from the light as recorded their transmittance. We did the same at 10 and 15 minutes and recorded our results. 

Data

This graph shows the transmittance percentage of each cuvette from our lab. We got this data from the LoggerPro and recorded the measurement at different times.

Graphs

This graph shows the results of our data In the key, the colors correspond to the numbers and the number represent the different cuvettes. The numbers and the type of cuvette can be determined from the table above. As we can see, the cuvette with no chloroplast had no change while the unboiled/light had a great change. Unboiled/dark and boiled/light both decreased slightly.

Discussion
An important part of this lab was the use of DPIP, an electron carrier that served to replace NADP throughout the experiment. As our results will show, the presence of an electron carrier is essential in order for photosynthesis to take place at all. Five cuvettes were used in this experiment to test what ingredients are needed for plants to make sugar and survive with sunlight, water, and good soil. In the first cuvette, we added our chloroplasts but did not supply an electron carrier. Without electrons, we cannot create ATP molecules to power the Calvin Cycle, where our sugar is actually created via carbon fixation. In addition to this, the second cuvette was wrapped in film to keep out light, proving that light energy must be absorbed by the plant pigments in order to excite electrons. Our third cuvette was truly the only specimine that should have shown a high level of transmittance, because the environment had all of the necessary components to photosynthesize, reduce DPIP and essentially turn the color of the cuvette clear. In doing so, light would pass through it in the colorimeter and yield a low absorbance level when compared to the other four cuvettes. As for the fourth cuvette, we were able to prove that chloroplasts must be alive for DPIP to be reduced. Our fifth cuvette acted as another control when no chloroplasts were added at all, and this creates a serious problem for the plant if there are no reactants to power the dark reactions. With five cuvettes to test five different combinations, we were successfully able to determine a powerful recipe for plants to use when making their own food.

Conclusion
Our data was complex, but in the end, it was the tubes with the chloroplasts that absorbed the most light especially before the possible errors in calibration. This makes sense, as the chloroplasts role in a plant is to absorb light and donate electrons so the processes of photosynthesis can carry out.


References
http://www.ruf.rice.edu/~bioslabs/methods/protein/spectrophotometer.html
http://en.wikipedia.org/wiki/Dichlorophenolindophenol


Glowing Spinach

We were all confused when Mr. Filipek told us to go an make spinach glow without any direction. After playing around with the different solutions and equipments, we finally figured it out. We ripped up the spinach into tiny pieces and placed them in a funnel. We placed the funnel in a beaker and then added isopropyl alcohol into the funnel to drip through. At this point, Judd decided to get his hand dirty and rubbed the spinach and alcohol. Afterwards, we poured a little bit of the liquid into a graduated cylinder and shined a backlight through. And voila! Spinach glowed red!


When running the alcohol through the spinach leaves, we were able to extract chlorophyll into the liquid.The chlorophyll absorbs photons and takes it from its ground state and into an excited state. This raises the energy level and releases heat and fluorescence. This fluorescence is what causes the liquid to glow red with the help of a black light. 

References
http://c-lab.co.uk/default.aspx?id=9&projectid=58
Biology Book


Monday, November 17, 2014

Cell Respiration Lab


Exercise 1A

Purpose 
The purpose of the lab is to see cellular respiration happen before our very own eyes. From our power point, we know that within cellular respiration, CO2 is released and O2 is used. So, in this lab, we should see an increase of CO2 and a decrease of O2 from the peas and mung beans. In addition to the germinated, we will test non germinated peas and cold peas. 

Introduction

Cellular respiration is the process in which plants use and release chemical energy of organic molecules that is stored in glucose. Energy that is inside of glucose is used to produce ATP which supplies energy needs of the cell. If it is has a suitable amount of oxygen present, glucose is oxidized and releases energy. The breakdown of glucose to carbon dioxide and water is performed with two requires steps; glycolysis and aerobic respiration. 

Equation For Cellular Respiration: C6H12O6 + 6O2 -> 6CO2 + 6H2O + energy


Methods 


This lab was really fun because we got to play with fun gadgets this time. So the first thing we did was set up the lab on the Lab Quest, plugged in the CO2 and O2 sensors, and placed the peas into the container.


It's a shame that the electronic thermometer didnt work for our lab. Instead, we did it with an actual thermometer.


The thermometer reads 22 degrees Celsius 


Once we finally go everything into place, we started the lab and let it run for 10 minutes.


Here's a picture of Judd and Kenny analyzing the graphs!

After collecting the data from the Lab Quest we repeated the steps again except with cold peas and then non germinated peas. This picture shows Judd removing the already cold peas to put them inside the container. 


Charts and Graphs
By using two different species of peas separately, we found that the type of pea used does not affect the rate of cellular respiration.

As the peas began cellular respiration within the sealed container, the concentration of carbon dioxide gradually increased at a fixed rate. This information that we gathered is sound because carbon dioxide is one of the main products in cellular respiration, similar to the way humans exhale.


Because the container only has a limited supply of oxygen, it makes sense that the oxygen should gradually decrease in concentration as the time of the experiment increases.

Although this graph can be a bit wacky, the line of best fit still supports the other findings within this exercise.


Similar to the previous image, a line of best fit is oftentimes essential for seeing correlations within a particluar exercise.


Here is a graph noting all the experiments conducted and results gathered.Similarities can be drawn from the behavior of oxygen and carbon dioxide ammounts over time.


Based off the information gathered in this chart, we know that the temperature of the environment does not affect how fast an organism produces ATP.


Noting the temperature of the water was important for determining how particle movement affects the rate of cellular respiration.

Discussion 
Perhaps a common misconception is that since the germinating seed is a plant and an autotroph, then it must make its own food through photosynthesis, and we should see the opposite of what the graph is showing: A rise in oxygen and a decrease in carbon dioxide. Instead, the opposite is depicted. Why is that? In the wild, seeds are generally planted underground where there is no sunlight. In order to break through the soil and begin photosynthesis, the plant must attain energy through some other means besides the sun. In all plants, this energy source is the seed itself. As soon as a seed germinates, it begins to feed off the energy stored in the seed, which is in the form of a mix of macromolecules. In order to break down these macromolecules, the seed must engage in conventional cellular respiration. This is why oxygen levels decrease and carbon dioxide levels increase.
 
 
The seeds we used are no different from this germinating Quercus rubra (northern red oak) acorn. The young plant feeds off the acorn until it sprouts and grows a leaf. As soon as a leaf grows, the products of photosynthesis takes over as the plant's main energy source.
 
While our results showed that cellular respiration is independent of temperature, this is actually false. Cellular respiration is dependent on proteins, which can denature if temperatures are not right. This error is most likely due to the short amount of time the seeds were exposed to cold temperatures. Also, it is very likely the seeds warmed toward the end of the 10 minute test as well. The non-germinated seeds did not engage in any significant cellular respiration, as they are in a period of dormancy. Having seeds that can stay dormant for long periods of time are advantageous to plant species reproduction, as there will be a higher chance that the seed will end up in a favorable environment given enough time.
 
Conclusion
From the results of the lab, it is shown that respiration rate is affected by temperature; colder temperatures result in a slower respiration rate while warmer temperatures allow for a faster respiration rate. The Co2 sensor provided the information that germinated peas gave off more Co2 than the non germinated peas. Through the oxygen sensor we could tell that the germinated peas consumed more oxygen than the non germinated peas.

Friday, November 7, 2014

Enzyme Catalyst Lab

Enzyme Catalyzed Reactions (Including Base Line)
 
Purpose
 
In this first part of the lab, we will determine how excessive pH effects the productivity of an enzyme. Some enzymes work well at higher pH's, while others are more adapted to lower ones. Regardless, every enzyme has an optimum and preferred pH range to work in. By moving an enzyme outside its comfort zone, we will observe the result by noting the change in the rate of the metabolic reactions taking place at the same time. Changing the pH will denature the protein

Introduction

This lab will focus on enzymes and their role in accelerating metabolic reactions by reducing the amount of activation energy required to start a given reaction. Enzymes are simply proteins produced by cells and are catalysts. It is important to understand that catalysts will always assist the reaction without being used up in the process. Therefore, enzymes within our body will continue to operate efficiently unless they encounter an adverse conditions, such as an acidic solution or extreme temperatures. Finally, each type of enzyme is specific to a particular substrate, like sucrase working primarily with the substrate sucrose. In order for our body to break down a myriad of food items, we need a large quantity enzymes to bind with as many substrate molecules as possible so that reactions can be fast and effective.
 
 
Methods


For the Base Line Lab we added 10 mL of H2O2, then 1mL of water, and 10mL of H2SO4. Lastly, we added KMnO4 into the 5 mL solutions which we added little by little and mixed in between the drops until the solution turned a bright pink


Similar to be base line lab, we added 10 mL and (instead of water) we added 1 mL of catalase extract. At different time intervals, while mixing at the same time , we added 10 mL of H2SO4 into the beaker.


Data & Graphs
 
This table shows the results of our enzymatic reaction. As the time increased, the amount of KMno4 decreased while the amount of h2o2 increased. 
 
This graph is taken from part e of the data table. As the independent variable, time, is increased, the amount of H2O2 is also used up. This graph shows an increase of hydrogen peroxide used up from 10 to 30 seconds, then a dramatic decrease, and then a more stable increase until 180 seconds. 
 
Discussion
 
For the most part, our results in this lab were fairly close to what is to be expected, with only one major outlier due to experimental error. The summary of our results can be explained by this sentence: The longer the hydrogen peroxide is exposed to the enzyme catalase, the more of it is broken down to water and oxygen gas. The base line titration had the highest amount of KMnO4 used because it had the highest amount of hydrogen peroxide, as almost none of it was decomposed (the table shows the amount of hydrogen peroxide used, not the amount of KMnO4 consumed).  As soon as we added the sulfuric acid which significantly lowered the pH, the enzymes (as a globular protein) were denatured and the reaction slowed down significantly. From this conclusion, it can be hypothesized that changing other factors, such as temperature, would also promote or inhibit the reaction rate, because proteins can denature when exposed to temperature extremes. By looking at the graph, it is easy to tell there is a serious problem with the 60 second reaction. It does not follow the generally increasing slope of all the other points. One possible explanation would be that water was accidently mixed with the hydrogen peroxide as they are both clear liquids. This would significantly dilute the hydrogen peroxide in the solution to a point where KMn04 titration would take place rapidly and with little KMnO4. Overall however, the longer the reaction rate the greater the amount of hydrogen peroxide converted and the less amount of titrate used.
 
Conclusion

This lab shows how enzyme catalase increase the rate at which h202, hydrogen peroxide, decomposes.When enzyme catalase is added to h202, the catalase is denatured and oxygen is released. Enzyme catalyzed reactions  are affected by the environmental factors and changes such as temperature, pH levels, substrate concentrations, and enzyme concentrations.When we added sulfuric acid, the catalase wasn’t able to break down the hydrogen peroxide due to the change in environment, the ph change, which denatured the enzyme.
 
References


Uncatalyzed Reactions
 
Purpose
 
Lowering the activation energy of a reaction will reduce the change in free energy when the reaction takes place, and allow the transformation of reactants into products to occur faster and more often. To see just how essential enzymes are to living organisms, we will note what happens when a reaction takes place without assistance from enzymes.
 
Introduction
 
Reactions can take place without enzymes-it just takes a lot more time and energy to get the reaction going. Hydrogen peroxide naturally breaks down into oxygen gas and water over time, as the reaction is spontaneous. The change in free energy is negative. HAVE KENNY ADD MORE TO THIS
 
Methods
 
 
This picture above shows the bubbling of H2O2 when catalase was added. This bubbling represents the O2 gas being released while the H2O2 


Data & Graphs


Discussion
The results of this lab indicate that the breakdown of hydrogen peroxide to water and oxygen will take place even without a catalyzer. What this proves is that the breakdown of hydrogen peroxide is spontaneous: the reaction releases energy, or is exergonic. In this case, given enough time, hydrogen peroxide will decompose on its own. The activation energy for this reaction, which was significantly reduced by adding catalase, is overcome in this instance by some other means. It is quite possible that the activation energy for this lab came from the atmosphere, as hydrogen peroxide does not decompose this quickly when placed in a sealed container. Nonetheless, this experiment showed that spontaneous reactions can and do occur even without a catalyst.
 
Conclusion


References


Saturday, October 25, 2014

Diffusion Osmosis Lab

Exercise 1A :)

Purpose
The movement of a solute through a selectively permeable membrane is called dialysis. The dialysis tubing used in this experiment has microscopic holes that allow small particles or molecules to move freely through the membrane while larger compounds will take longer to diffuse through, or may not move at all. In this first activity, we will allow a single piece of dialysis tubing filled with glucose to sit in a solution of distilled water. We will know if the tubing is permeable to glucose if upon testing for said sugar, we find traces of it in the solution surrounding the dialysis bag.

Introduction
The development of dialysis tubing and dialysis machines during the mid 20th century changed the way biologists and other scientists looked at the semi-permeable cell membrane. Once blind hypothesizes and speculation, the experiments conducted with dialysis tubing allowed scientists to see before their very eyes the nature of selective permeability, which means to allowing some substances through while blocking others. And thus, in this experiment, we follow in the footsteps of the early scientists as we truly see selective permeability in action. By seeing it in large scale, it is easier for us to imagine the microscopic environment of a cell membrane in a living cell. While the membrane is selectively permeable, the force that drives the movement of particles across is diffusion. Diffusion is the spreading of particles from a high concentration to low concentration. For example, say one lights some sulfur on fire in a classroom and then quickly extinguishes the flame. At first, the air near the burned sulfur would smell strongly of rotten eggs. Wait a few minutes though, and the whole room would end up smelling like rotten eggs, although less strongly than in the first instance. This is because the smell spreads out from an area of high concentration to an area of low concentration. The end result is dynamic equilibrium: The particles of sulfur are moving around in the air, but there is no net movement of particles. This process is similar with a selectively permeable membrane.

 Methods


The distilled water tested positive for glucose after the dialysis bag spent several minutes submerged in the solution. This information proves that the dialysis pores are permeable to the sugar molecule glucose


Data

Change Tubing Color Over Time

Chart
This table shows what the solution color appeared as in both the dialysis bag and the beaker at the beginning of the experiment and again towards the end. The change in color indicates the presence of glucose and whether it all stayed inside the dialysis bag/beaker or if it diffused out.


Discussion
When the bag started out opaque, it was a solution of 15% glucose and 1% starch. Once we let the dialysis bag sit in the solution of iodine, it was able to diffuse out and thus change the color of the bag. Through the changes in color of the solution in the dialysis bag from opaque to black, we are able to conclude that when the glucose inside the dialysis bag diffused into the beaker full of the iodine water and the iodine water went into the bag which changed the color of the solution inside the bag to black. While the iodine solution was orange at the beginning, it remained the same color throughout the experiment. Initially we thought the glucose would diffuse out of the dialysis bag into the iodine water, and our hypothesis was correct. Water molecules are the smallest, then IKI molecules, glucose, and starch. Glucose, water, and iodine (IKI molecules) were small enough to pass through the dialysis bag which was used as a selectively permeable membrane. If the experiment were to be modified so that the water diffused  into the dialysis bag, the water and starch would have to start off in the beaker while the glucose and IKI molecules would start inside the dialysis bag.

Conclusion
As the results of the lab showed, smaller molecules such as water, glucose, and iodine are able to pass through a selectively permeable membrane. This was shown through the changes in color of the solutions which proved that when certain molecules diffused in and out of the dialysis bag, the colors changed.

References
https://www.boundless.com/physiology/textbooks/boundless-anatomy-and-physiology-textbook/cellular-structure-and-function-3/transport-across-membranes-42/osmosis-331-11470/

http://www.davita.com/kidney-disease/dialysis/the-basics/the-history-of-dialysis/e/10431


                               Exercise 1B


Purpose
Osmosis is the movement of water from a high concentration to a low concentration within a solution. In this second part of the experiment, we have several dialysis bags filled with different molarities of sucrose. We will place these bags in separate tanks of distilled water, and see after 30 minutes where the water moved. If our bags increase in mass, we know the bag was in a hypotonic solution, which allows water to rush inside our mock cell. Other wise, should the bag lose mass, then the solution was hypertonic, and water diffused out of the cell where a majority of the sucrose could be found.

                                            Introduction 
Now that we have established what selective permeability and diffusion are like on a large scale, the next exercise is all about how solute concentration can affect diffusion across a selectively permeable membrane. Again, I would like stress that diffusion is the spread of particles from a high concentration to low concentration. When a solute is present that cannot cross the membrane, the permeable solvent (usually water) will still achieve equilibrium with the solute, even if it means that there are different amounts of water on each side of the membrane. Thus we get three states, called hypertonic, isotonic, and hypotonic. A membrane placed in a hypertonic solution will loose water because there is a higher concentration of solute outside the membrane. In an isotonic solution, the concentrations inside and outside of the membrane are the same, so there is no net water movement. Finally, a membrane placed in  a hypotonic solution will gain water because there is a higher concentration of solute inside the membrane.
Methods


Each dialysis bag was assigned a different molarity of sucrose to determine how the tonicity of the solution affects increase or decrease of the dialysis bag's mass.

The solutions were ordered by increasing molarity, as shown in the picture above. Each dialysis bag was carefully blotted and massed before and after being submerged in its assigned solution. From this information, we were able to determine a percent change in mass for each dialysis bag.


Data

Mass of Dialysis Bags after Being Submerged in Sucrose 


Graphs
As the molarity of the solutions in the beaker increases, the mass of the bag also increases.


Discussion

This lab demonstrates the process of osmosis through the movement of water from the beaker into the bags containing the sucrose. As the amount of sucrose of each bag (independent variable) increased, the weight of the bag (dependent variable) itself also increased. When we placed the different sucrose bags within the beaker filled with distilled water, the water began moving from the beaker, through the permeable membrane, and into the bag. This movement of water from an area of high concentration to lower concentration is called osmosis.This is evident though the increase of weight within each of the bags. Also, because each of the bags contained a different amount of sucrose concentration the amount of water that moved within each bag also differed. As a result, the graph displaying the weights of the bag increased as the amount of sucrose concentration was increased. The only concern for this lab is that the bag of distilled water within the distilled water beaker also increased in weight which should not have because it should already be an isotonic solution. This increase in mass might have been due to the excess water on the bag after we pulled it out the beaker and weighed it again. Otherwise our predictions about the bags all increasing in weight were correct. 

Conclusion
In this lab, we were testing the relationship between a solute's concentration and the movement of water molecules through a selectively permeable membrane. Water moves quickly through the dialysis bag, our selectively permeable membrane, in order to reach equilibrium between the two solutions.

References
       http://teachers.henrico.k12.va.us/godwin/strauss_s/sscwebpage/tutorials/cell_transport_tutorial.pdf       

                              Exercise 1C
Purpose
This activity involves the use of potato cores, which function as non-living plant cells but will still abide by the rules of water potential and solution tonicity. In a similar manner to the dialysis bags, we can determine a solution's water potential by finding the masses of each potato core before and after being submerged in the given solution. Water will always move from a higher to lower potential, so in the case where more of the solute is outside the cell, there is more water within the potato core and therefore more potential. So water therefore leaves the cell and the mass steadily decreases until the solution is isotonic and secured at equilibrium.

                                           Introduction 
When we combine all of the concepts we have learned above and combine them, we get water potential. Water potential is not a process, it is merely an explanation to better define how water diffuses. Water diffuses from an area of high water potential to area of low water potential. Water potential is dependent on two thing, solute concentration and pressure. Below is the full equation:

The potential of pure water is zero, thus water potential cannot be positive. Its highest value is zero. Although this sound mightily similar to hypertonic, isotonic, and hypotonic solutions, this of it like this: water potential is partially based on solute potential. The solute potential of solutions on either side of a selectively permeable membrane is dependent on the solution the membrane is in is hypertonic, isotonic, or hypotonic.
Methods


Tom Judd uses a metal rod and hollow tube to harvest the potato cores

Four potato cores were assigned to each molarity, and when dried we noted which cores belonged to which solutions.

It is important to note that the potato cores in hypotonic solutions (left of picture) increased in size and mass, while the cores in hypertonic solutions (right of picture) shriveled and decreased in mass.


Data

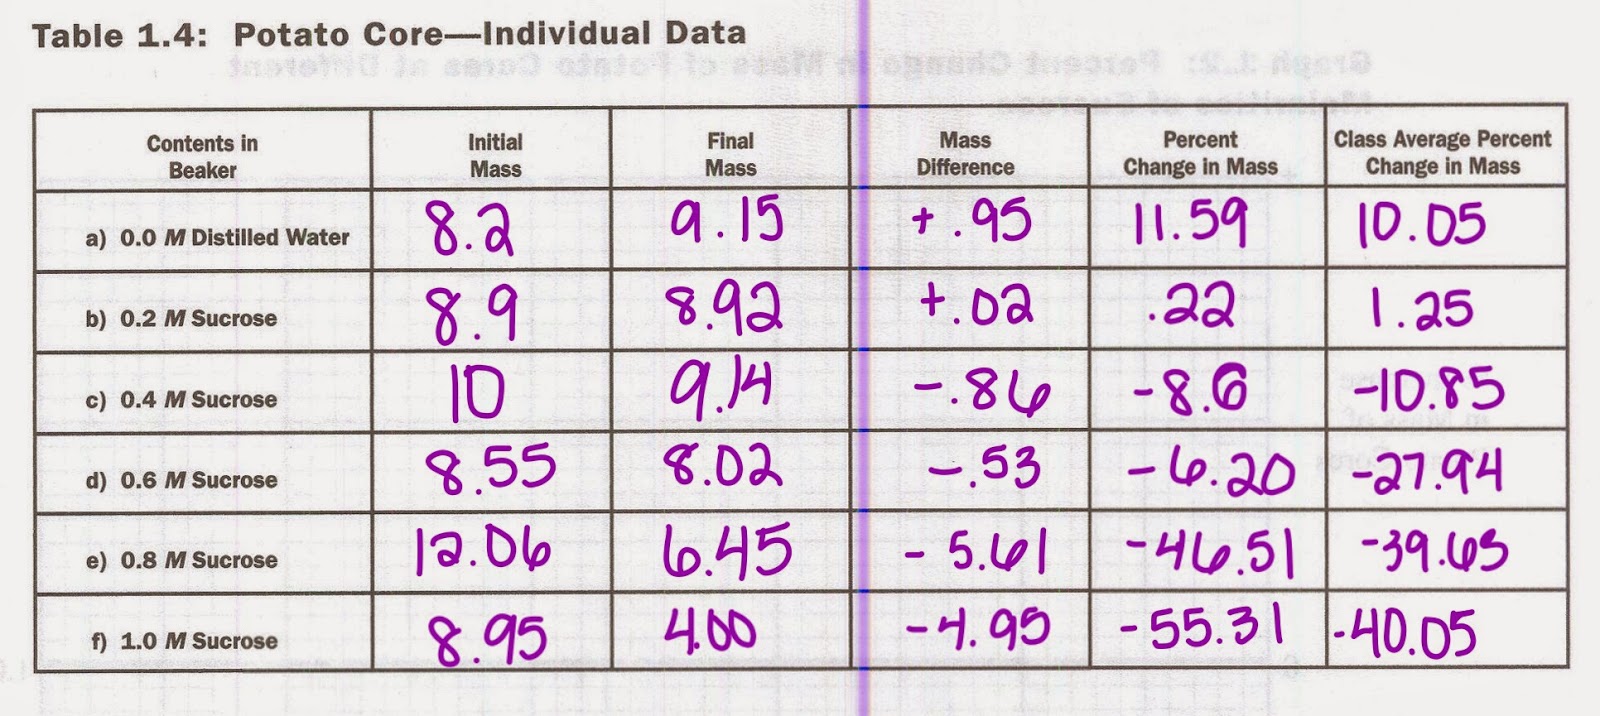
Mass of Potato Cores and Percent Change 


 Graphs and Charts


In this graph, the change in mass of potato cores decrease as the sucrose molarity increases except for one outlier within the .6M beaker.


Discussion

Through the results of this lab, we have discovered that the potato increased in weight when it was placed in the solution of distilled water, but then decreased in weight as the sucrose molarity increased. This increase of weight of the potato molecule is due to the fact that the potato itself contained amounts of sucrose. This means that the concentration was higher inside the potato, and that water will rush into the potato to make it swell and gain mass. Then, as the concentration of sucrose in the beaker increased, less water moved into the potato until it reached a point where the concentration of sucrose outside the cell also equaled the concentration inside the potato. This equilibrium point is marked on the graph as the point where the line hits the 0 on the x-axis. Once the concentration of sucrose within the beaker became greater than the potato, the potato lost water/ weight due to the osmosis of water from low to high concentration. This caused the potatoes to shrink and shrivel because of this water loss. A problem that we had with this lab is that we had an outlier within our results. For the .6 M sucrose concentration, instead of steadily decreasing like the rest of the results we had, the .6 M had a lower change in mass than the .4 M sucrose beaker. This outlier might have been due to not weighing the potatoes correctly or the slight confusion we had we took out the potatoes and lost track of two of the lab results. So, for next time, we now know to be extra careful when handling multiple tests and to keep track of everything. Especially when we have 24 slices of potatoes on the table!

Conclusion
Through this lab we discovered that potatoes contain sucrose molecules which makes them want to take in water in order to become a hypotonic solution which makes the plant turgid. This shows that potatoes have a lower water potential and a higher solute potential than the distilled water solution because they wanted to take in water.
References
http://www.phschool.com/science/biology_place/labbench/lab1/watpot.html


Exercise 1D

By using this equation for solute potential and the molecular concentration of .3 M from the previous lab, we are are able to find the water potential. Water potential of the potato cells is -7.35435 bars. So, if the water potential of the solution is lower than this, water would diffuse out. And if the water potentiometer of the solution is higher than -7.35435, water would diffuse in. 


Exercise 1E

Plasmolysis is the shrinking of the cytoplasm within plant cells. The cell wall is moved further from the cytoplasm and cellular membrane. Plasmolysis happens when plant cells are placed into a hypertonic solution and water diffuses out of the plant cells. 


This picture is an example of what happens within a cell during plasmolysis 

A common accurance of plasmolysis happens here every winter when is snows. As the snow plows are hard at work to move and salt the snow, some of the salt reaches the grass. This then causes the grass to die. This happens because the concentration of he salt outside the plants are higher which causes the water to diffuse out. This loss of water is bad for the plants because in order for plants to be healthy, they must be placed in a hypotonic situation. 


References: 
http://www.tutorsglobe.com/homework-help/botany/plasmolysis-73486.aspx --- plasmolysis picture

 https://www.shodor.org/master/biomed/physio/dialysis/hemodialysis/fivea.htm --- history of dialysis tubing