Monday, March 16, 2015

PGLO Transformation Lab

Purpose

     In this experiment, we were observing bacterial growth and transforming the bacteria. The process allowed us to further understand how transformation occurs, what happens biologically to the bacteria when genes are moved, and the significance this process has on life in both prokaryotic and eukaryotic cells.

Intro

     Transformation is a process used in prokaryotic as well as eukaryotic life cycles to genetically modify a cell by introducing  separate DNA into the cell with the help of a plasmid. Plasmids are genetic structures in a cell that are often used in laboratories to manipulate genes. They are small, circular DNA molecules in the cytoplasm of cells that carry supplementary genes and replicate independently of the chromosome. They can even lead a cell to being antibiotic resistant. The pGLO plasmid contains genes for green florescence (GFP) as well as a gene that has resistance to the antibiotic ampicillin. Scientists such as biochemists sometimes use a method called heat shock which is where cells are put into a higher than ideal temperature of the organism. This method opens up pores in the plasma membrane due to the sudden increase in temperature, allowing plasmids to enter the bacterial cell.

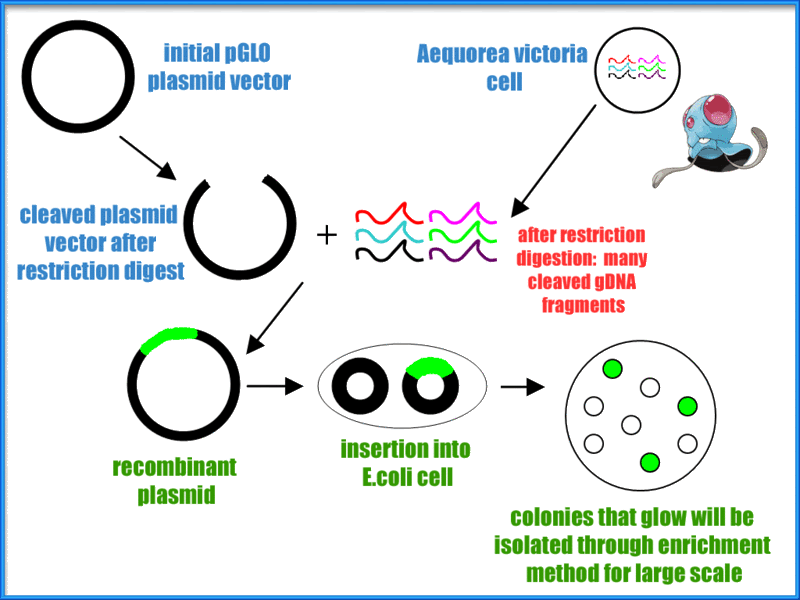
Methods
Because this lab involved E.coli and making it antibiotic resistant, extra precautions, sterile equipment, and good lab techniques were used while doing this lab. No one was harmed during this genetic transformation.

Micro test tubes were labeled +pGLO and -pGLO and transformation solution was added into each tube.

Using sterile loops, we picked up the E. Coli and placed them into both test tubes.


All the while both test tubes were immersed in a cup of ice in order to keep them cold. Then we grabbed another sterile loop and obtained pGLO plasmid DNA where we only placed into the +pGLO and not the -pGLO. After ten minutes sitting in the cup of ice, we heat shocked the test tubes. This meant putting both tubes into a 42 degree Celsius water bath for 50 seconds then placing it back into the ice immediately afterwards. Next, LB nutrient broth was placed into both test tubes. Finally, we placed the +pGLO into the LB/amp and LB/amp/ara transformation plates, the -pGLO was placed into the LB/amp and LB control plates, and gently spread the the liquid across the plate. The only thing left to do was to put them into the incubator and wait.

Our lab group was stunned by our results. The following pictures are what we saw the next day under UV lighting:

The glowing E. Coli under ultraviolet light. We have a large culture here, effectively telling us that the lab was an overall success.


A different culture with even better growth than the previous one. This culture happens to include the E. Coli that were antibiotic resistant to the Ampicillin

E. Coli alone in nutrient broth

E. Coli in nutrient broth with ampicillin. We cannot expect quality growth in this culture from bacteria without the inserted plasmid to make them resistant to ampicillin.


Data


Here is our math to determine how well the bacteria altered its genome to incorporate the new pGlo plasmid


Discussion
Our E. Coli pGLO transformation lab had the best results out of any lab we have done this school year. Plentiful colonies of E. Coli were produced on the control LB plate for both the wild-type and recombinant pGLO E. Coli. In terms of recombination efficiency, it was a complete success: we had one of the highest efficiencies of any lab group. Recombinant E. Coli flourished on the LB plate with ampicillin and fluoresced on the LB plate with ampicillin and arabinose as expected:


 The wild-type E. Coli, as expected, did not grow on any LB plate with ampicillin. Even on these empty plates, there was very little contamination. 

We contribute our success to our meticulous following of lab procedures. We used the correct amounts of materials and were not lax when it came to correct timing for the heat shock. The transfer from cold to hot to cold was immediate and precise. Our results confirmed our hypothesis perfectly: naturally, the antibiotic resistant E. Coli would grow in an ampicillin rich environment, while the wild-type would not. Overall, we are very pleased with our results.   

Conclusion

By shining ultraviolet light on the petri dish and seeing E. Coli glow in the dark, we had visual proof that the plasmid had been successfully incorporated into the bacteria cells. In addition to this, only bacteria with the inserted plasmid could grow on the ampicillin culture, which also tells us that this population of E. Coli is resistant antibiotics. This lab is designed to show how genetic engineering works and the fascinating results following the simple insertion of just one new gene to the bacteria's genome. This practice is something scientists are studying on a much larger scale with the hope that humans may find additional benefits from using restriction enzymes to alter the human genome.


References
http://www.cliffsnotes.com/sciences/biology/microbiology/microbial-genetics/the-bacterial-chromosome-and-plasmid

en.wikipedia.org/wiki/Heat_shock

http://www.jove.com/science-education/5059/bacterial-transformation-the-heat-shock-method

Restriction Mapping Lab

Purpose
     In this experiment, we separated DNA fragments by the size of their base pairs and analyzed the digested sites where restriction enzymes cut. This helped determine the number of cut sites for each restriction enzyme and their positions next to each other. We determined the total size of the DNA strands by adding up the sizes of the fragments from each digest. Since we knew that smaller DNA fragments migrate quicker than the larger ones, we were able to use the data for gene mapping.

Intro
     Molecular biology techniques often include the use of restriction enzymes to digest DNA as well as the separation of DNA fragments with the help of agarose gel electrophoresis. These techniques can be used for gene mapping and even for studying human genetic diseases. Restriction enzymes are enzymes that have the property to catalyze the cleavage of certain DNA molecules at specific base sequences. They are used for chromosomal mapping and also for gene splicing in recombinant DNA technology. Gel electrophoresis is a method used in labs to separate DNA, RNA, and proteins by their molecular size. In the process, the molecules are separated by being pressed through a gel (often agarose gel) by an electrical field. A negative charge is applied so that the molecules move towards the positive charge to be analyzed. 


Methods

The first thing that we did was use a needle point pipet in order to load the DNA into the gels, the first column contained the pMAP or lambda (“clear”) which will act as a marker within our results. Skipping the second, the third column contained PstI (“blue”), the fourth PstI/SspI (“red”), the fifth PstI/HpaI (“white”), and the sixth column with all three PstI/SspI/HpaI (“yellow”).

A picture of our group's gel; GO GO GO!


After placing the DNA into the wells (which was actually harder than it looks… at least for our lab group…), we closed the top of the electrophoresis chamber and turned on the voltage. As a result, the DNA should move from one end to the other positive side of the electrophoresis apparatus.


When we came back the next day, the gels were stained in order to make it easier to see the marks on the gel.


Graphs and Charts

Our picture of a plasmid with the restriction enzymes in their approximate location. 

Discussion

Although our results were not the best because our group had trouble placing the DNA into the gel, we were still able to draw data from the results of other lab groups. With the help of the marker lane on the far left of the gel, we were able to approximate the distance between the different restriction enzymes within a plasmid. The PstI well should only have one marker, the middle should have two and the farthest right should have three markers. By using this approximation, the distance of the strands should have been a total of 3900 and each column should have that total.  


Conclusion
The results from the gel tell us the approximate length of each band, which allowed us to visualize and the draw a full plasmid, annotated with the locations of each band along the ring-like structure. This lab is unique because we see how biology comes into play with forensic science. Comparing the band patterns of a suspect and victim creates a very powerful convition case if there is a clear match. Gels are simple to use, easy to understand and remarkably accurate, so it's no wonder that this concept has appeared on the AP Biology test for 15 consecutive years.

References
https://barnard.edu/sites/default/files/inline/restriction_enzyme_digestion_lab.pdf

http://www.nature.com/scitable/definition/gel-electrophoresis-286


Friday, February 13, 2015

How to Extract DNA from Strawberries


Here is a little How-to list of how to extract DNA from strawberries. You will need a test tube, a plastic bag, a coffee filter paper, a pipette, DNA extraction buffer and icy cold isopropyl alcohol.


1. First, grab a strawberry and place it inside a plastic bag. Squish the strawberry to a pulp


2. Then fill a test tube a quarter full with DNA extraction buffer (soapy salty water) and pour it's contents into the plastic bag


3. Mix the buffer and smashed strawberries 


4. Grab another test tube and place a coffee filter paper at the top of the tube.
5. Strain the strawberry through the the coffee filter paper so that the liquid drips to the bottom of the test tube


6. When enough liquid has reached the bottom of the test tube, throw away the coffee filter paper and the strawberries.
7. With you test tube with the strawberry liquid, fill it with some ice cold isopropyl alcohol by pipetting it down the side of the tube 
8. Wait a couple minutes and you should begin to see the DNA begin to form


9. Use something to pull the DNA out of the the bottom of the test tube and witness this amazing phenomenon! 


Thursday, January 8, 2015

Mitosis & Meiosis Lab


Exercise 3A: Cell Replication


Purpose
In this lab, we were investigating the process of mitosis by looking at slides of onion root tip. We were looking at the slides in order to see the products as well as the relative duration of the different phases throughout mitosis. By viewing the onion root tip cells, we were able to identify the different stages of mitosis in plant cells.
Introduction
In eukaryotes, mitosis is the process in which cell division results in two daughter cells with identical sets of chromosomes. The first and longest stage of mitosis is known as prophase, in which chromosomes become visible and centrioles separate in order to move to opposite poles of a cell. The second stage is called metaphase and this is where the chromosomes line up in the middle of the cell and connect to the spindle fibers at their centromere. The third step is anaphase, where the sister chromatids separate into individual chromosomes and they pull apart from each other. The fourth step is telophase and this is the last stage where the chromosomes all gather at opposite sides of the cell and they lose their rod like shapes. New nuclear membranes form around each DNA and the spindle fibers disappear. Cytokinesis occurs after the fourth step and the cell membrane pinches so that the cell finally divides into two.

Methods


The above picture illustrates a root cell during Interphase, or, the time during which the cell is not dividing. While the nucleus of the cell is visible (the red dot in the center). There is no chromatin evident under the lens of the microscope.

Now the cell enters the first phase of Mitosis, better known as Prophase. During Prophase, the cell begins to condense its chromosomes in preparation for division. If you look closely above, you may see small dots within the nucleus. The chromosomes are now visible simply because they are so concentrated within the nucleus of the cell.

This picture shows the cell in Metaphase, which is identiifed by the chromosomes lining up along the center of the cell.

In this picture, we see two nuclei and a cell plate, which means the cell is in Telophase. Once the cleavage has formed, cytokinesis will officially divide the cell into two identical daughter cells.


Data

This table shows the amount of each phase within each field. The time in each stage was found by multiplying the percent of total cells counted x 1,440 minutes. Interphase had the longest time and Anaphase had the least.


Graphs and Charts 

This is a pie chart of the onion root tip cell cycle and the data was provided by the table above!


Discussion


Conclusion
This lab served as an effective means to show real cells in each stage of mitosis. While it is good to describe each stage of the cell cycle, being able to recognize what process a cell is undergoing in real life is still a valuable skill. Aside from allowing us to see plant cells up and close, this is a powerful tool for reviewing Mitosis.

References 
http://www.cellsalive.com/mitosis.htm

http://www.marietta.edu/~biol/introlab/Onion%20root%20mitosis.pdf


Exercise 3B: Meiosis

Purpose
In this experiment, we were simulating the stages that occur in meiosis, a type of cell division in sexually reproducing eukaryotes, with the use of chromosome models. With the use of these models, we were able to look at crossing over, when homologous chromosomes exchange parts, as well as the recombination that occurs in the process of meiosis. 
Introduction 
Meiosis is the shuffling process of genes that occurs when organisms such as plants, animals, and sometimes fungi are ready to reproduce. Meiosis begins in prophase I; meiosis is when two diploid cells divide and then divide again resulting in four haploid cells. Genetic variation through meiosis occurs when maternal and paternal chromosomes cross over and exchange their segments. In metaphase I, the tetrads line up and in anaphase I the pairs of homologous chromosomes split up. 

The summarized steps of Meiosis

Methods/Discussion 
These beads illsutrate the appearance of chromatin during Interphase, when the cell is not dividing.


In Prophase I, the chromatin begins to condense and prepare for cellular division

Now the chromosomes break in certain sections, and swap genetic information with other chromosomes in order to acheive variability. This process is known as "Crossing Over"

The final result of "Crossing Over" One red bean and one yellow bead are exchanged to make the gametes different from their parents.


The area where Crossing Over ocurred is where the chromosomes will line up along the center of the cell.


Now the Sister Chromosomes separate, with one chromosome going to one side of the cell and part of it moving with the other chromosome to the other side of the cell.

The chromosomes then move to opposite ends of the cell and a nuclear envelope begins to form to separate the two chromosomes. Two haploid cells are thus formed and then the organism moves onto Interphase II (AKA interkinesis). 


These next pictures show what happens during Meiosis II where the chromosomes are slip in order to produce two more daughter cells. In this phase (Prophase II) centrioles move to the opposite sides of the cell.

The chromosomes then move to the middle of each of their own cell.


The centromeres and chromatids separate and move to the opposite sides of the cell.  


Finally the chromosomes are all separated and begin to form their own nuclear envelopes. The result is four daughter cells.


Data

This table shows the similarities and differences of mitosis and meiosis.

Discussion

Conclusion
The use of beads in this lab provides an effective way to view chromosomes conceptually. By using two colors (red and yellow) we are able to distinguish one chromosome from another and see how the process of crossing over occurrs and how this leads to genetic variability among gametes. We can look at a cell to understand Meiosis, but we cannot know how the cell undergoes this process without focusing on the chromosomes within.

References
http://www.marietta.edu/~biol/introlab/Onion%20root%20mitosis.pdf

http://www.biology4kids.com/files/cell2_meiosis.html

Friday, December 19, 2014

Cell Communication Lab

Purpose
In this experiment, we were trying to find out how yeast cells manage to communicate and thus mate asexually in order to produce offspring. In order for a message to be communicated, a signal must be sent and then received by another being; this lab will prove how yeast cells go through this communication process in order to produce a required response for the production of yeast.

Intro
Both unicellular and multicellular organisms use cell communication in order to elicit a response which helps an organism  coordinate and respond to their environment. Cellular communication can occur through direct contact, local signaling, or long-distance signaling. For a response to occur, a message much reach a receptor that is able to receive that type of message which then turns on the ability for many other reactions, or a cascade. Pheromones are a type of signaling molecule that is secreted from one organism  and detected from another organism thus providing various messages through this cellular communication and eliciting a change. 
 

As you can see above, the budding and single cells are both present on this slide. Budding cells are cells clumped together, while single cells are the ones all by themselves. Budding cells contain both a and alpha DNA, while single cells contain either one or the other.
 
Methods


In our experiment, we tested yeast reproduction. We grew yeast is two different environments: broth and a sugar like gelatin. We created three copies of each environment. One with only a type, one with only alpha type, and one with both. We then took samples and placed them under a microscope.


We then counted how many yeast were present on a sample size of our tray and recorded it into our data.
 
Data

Data was gathered by the picture taken through the microscope during the lab and counting out the cells found within that field

This table shows the number of single haploid and budding haploid cells within the alpha-type and a-type slides. As time increased, the number of budding haploids increased more than the single haploid cells. 


This is a similar chart except this one contains the the number of various cells and zygotes from the mixed culture. The budding haploid, shmoos, budding zygotes, and asci all increased after 24 hours in the incubator.


Graphs and Charts


This graph reflects the first table of the a-type and alpha-type cells 


This graphs reflects the second table above of the mixed combination of a-type and alpha-type cells


Discussion
Throughout this lab, there were a few notable differences between the A-type and Alpha-type strands of yeast while they were observed in their cultures. Over the course of the first night when stored in the incubator, the Alpha-type reproduced at a more accelerated rate than its counterpart. In addition to this, the genomes differed between both strands, yet under the microscope the behavior of each was nearly identical. In the isolated cultures, neither strand seemed to move, and no schmooz were formed. However, in the mixed culture, the pheromones from each strand were received by receptors within the plasma membrane of the opposite strand, and each strand morphed its physical structures to as to move closer to its counterpart. Schmooz can be detected by identifiying unique, irregular shapes of yeast when they are normally spherical, perfect circles.

It has become evident from this lab that yeast cells cannot communicate by direct contact, but strictly via pheromones. Yeast has no flagella or cilia to move, which is why schooz must be formed to acheive gradual movement across the dish. Pheromones are used to notify far-off yeast cells that the counterpart is present, so that they can reach each other and eventually mate. There is really no other means to communicate that other cells are nearby. Pheromones will be transduced faster if the yeast cells are closer together. For this reason, it is understandable if yeast cells that are further away take more time to respond by creating schmooz.

Conclusion
We can conclude from this lab that the most favorable environment for yeast reproduction is when there is ample food and both a type and alpha type present. This makes sense, as this is a very secure environment in which yeast can thrive. Although yeast can reproduce when there is only one reproductive type present, best results are achieved when their is a mix. It is always better to recombine DNA and increase genetic variability than to have many others have the same DNA. It leads to a higher survival rate for the species, because one genetic defect cannot wipe out the entire species.
References
http://rsob.royalsocietypublishing.org/content/3/3/130008

Carolina Cell Communication for AP Biology